Reflection 8
Exam 2 review
Computational questions (mandatory)
- Compute sample standard deviation by hand on the following data set:
x = 7, 12, 8, 6, 13, 12What is the area under a standard normal distribution (i.e. the percentage of data or probability) that lies to the left of z = -1.3?
What is the area under a standard normal distribution (i.e. the percentage of data or probability) that lies to the right of z = -0.7?
p = 0.1788 of the data in a normal distribution lies to the right of what z-score (1 pt.)?
Iowa averages 34.8 tornadoes per year with a standard deviation of 22. Assuming a normal distribution and statistical independence, what is the probability that it receives between 22 and 32 tornadoes in a year?
Conceptual questions (optional)
Explain the difference between mutually exclusive and independent events. You may use examples if you wish.
Describe a use case for the standard deviational ellipse.
Does standard distance (i.e., the multi-dimensional form of standard deviation) follow the 68-95-99.7 rule? Why or why not (2 pts.)?
Describe the following distribution in terms of kurtosis, skewness, and similarity to a normal distribution. You may calculate these values if you wish to confirm your answer (the dataset is
ggplot2::diamonds$depth).
library(ggplot2)

ggplot(diamonds) +
  geom_density(aes(depth), fill = "cyan")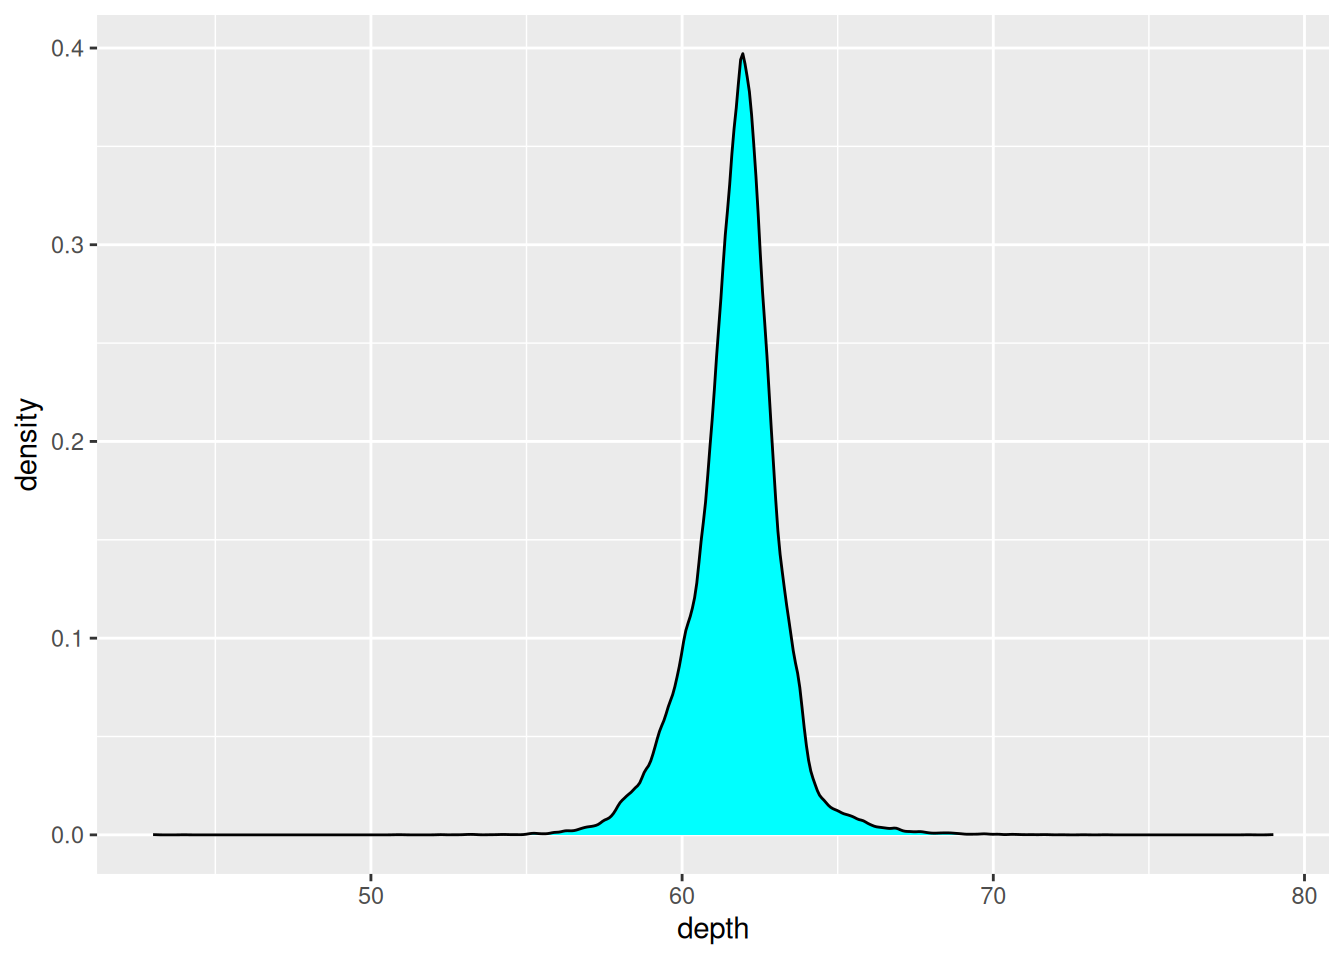
- Describe the following distribution in terms of kurtosis,
skewness, and similarity to a normal distribution. You may calculate these
values if you wish to confirm your answer (the dataset is
ggplot2::diamonds$carat).
library(ggplot2)

ggplot(diamonds) +
  geom_density(aes(carat), fill = "magenta")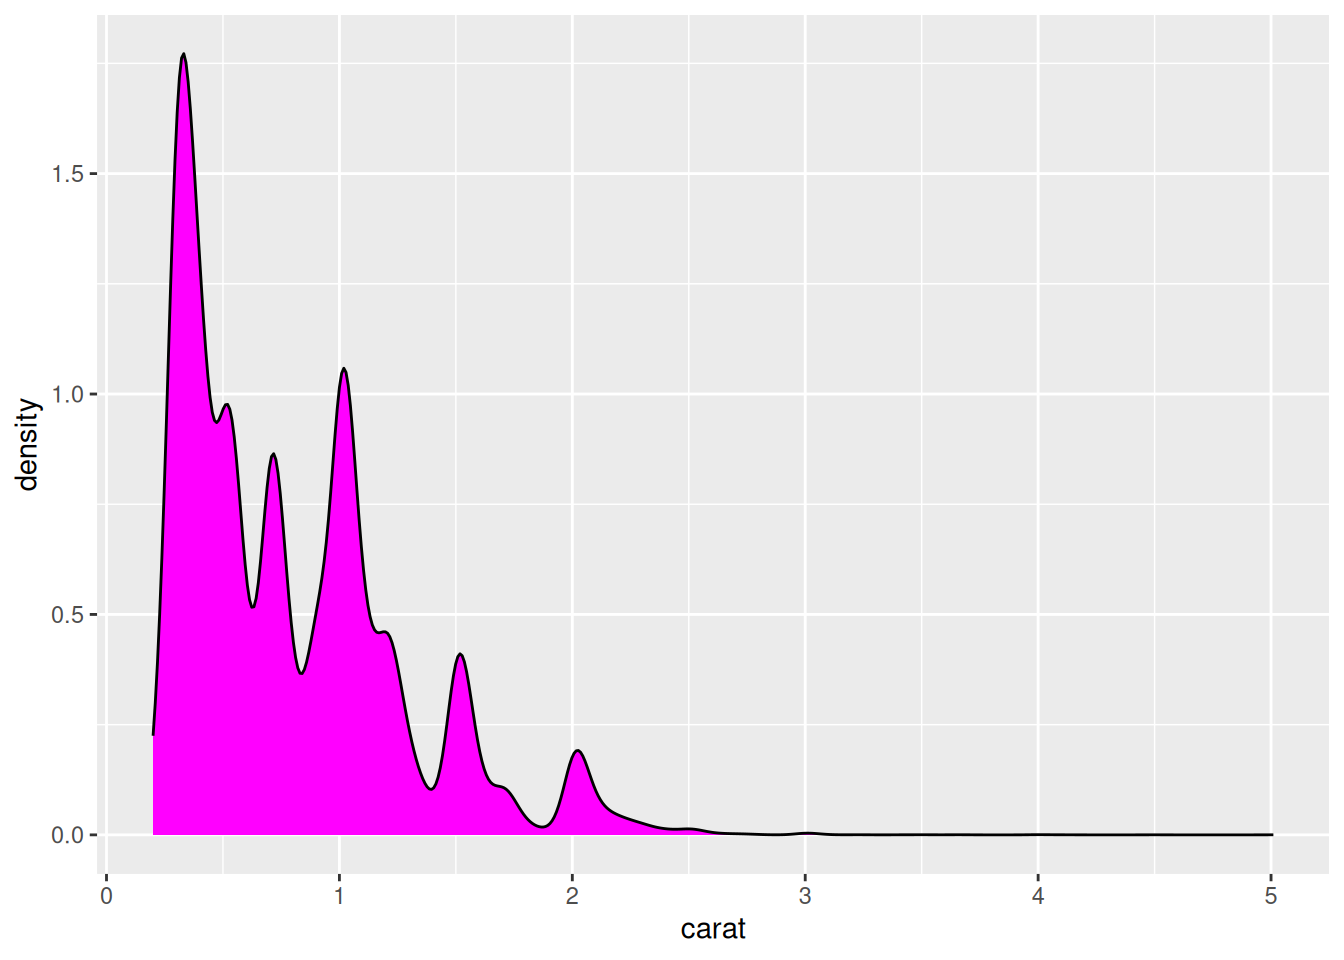
- Suppose there is population of 10,000 observations which roughly follows a chi-square distribution with 4 degrees of freedom:
library(haffutils)

set.seed(2023)
x <- rchisq(1e4, df=4)

pretty_dens(x)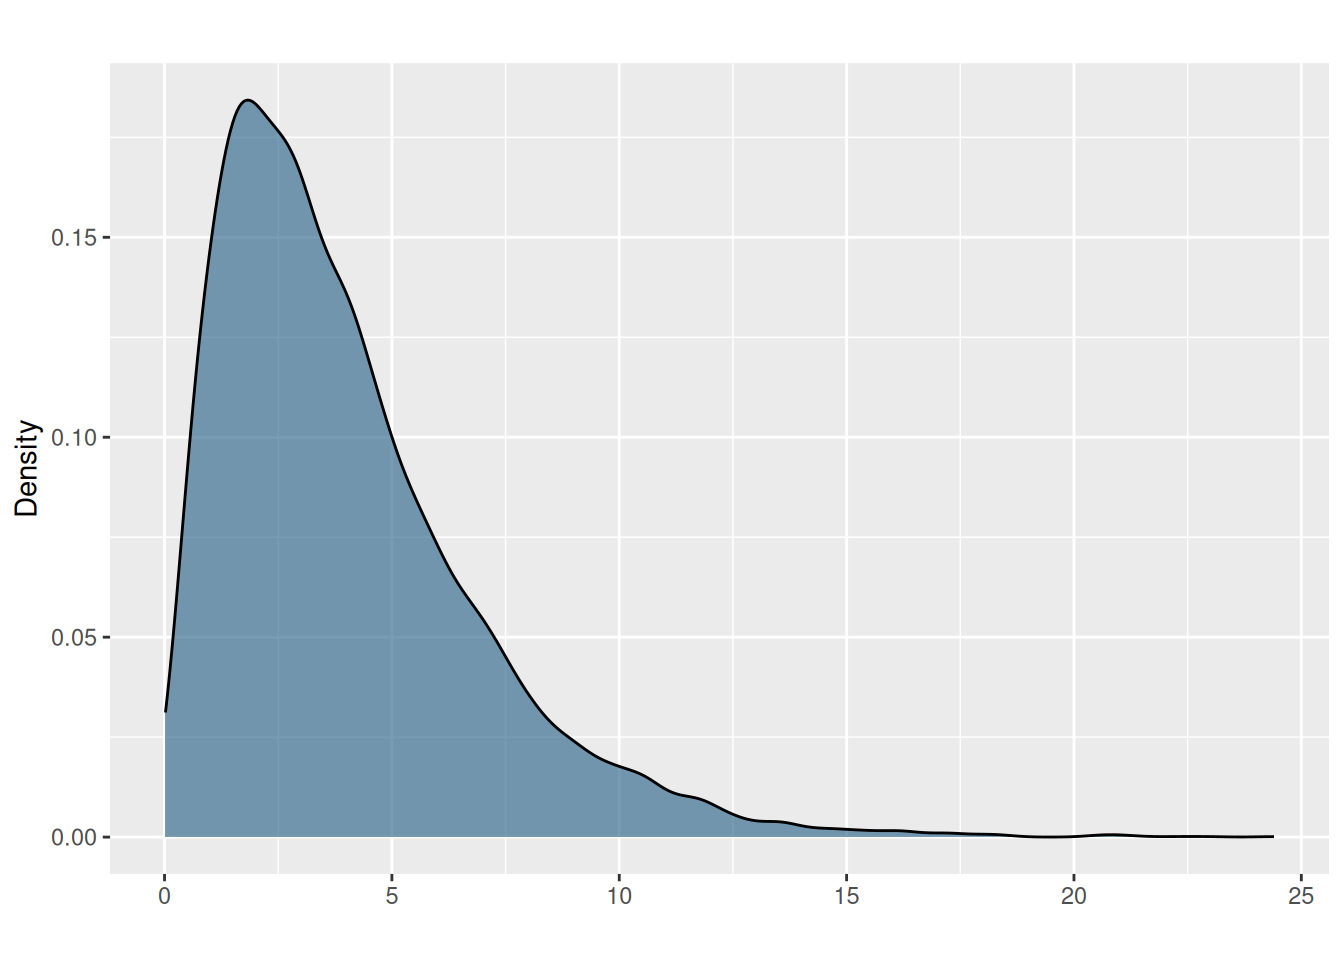
A sample of 1,000 values from this distribution will take on the shape of what distribution?
- Suppose there is population of 10,000 observations which roughly follows the additive inverse of chi-square distribution with 7 degrees of freedom:
library(haffutils)

set.seed(2023)
x <- 1 - rchisq(1e4, df=7)

pretty_dens(x)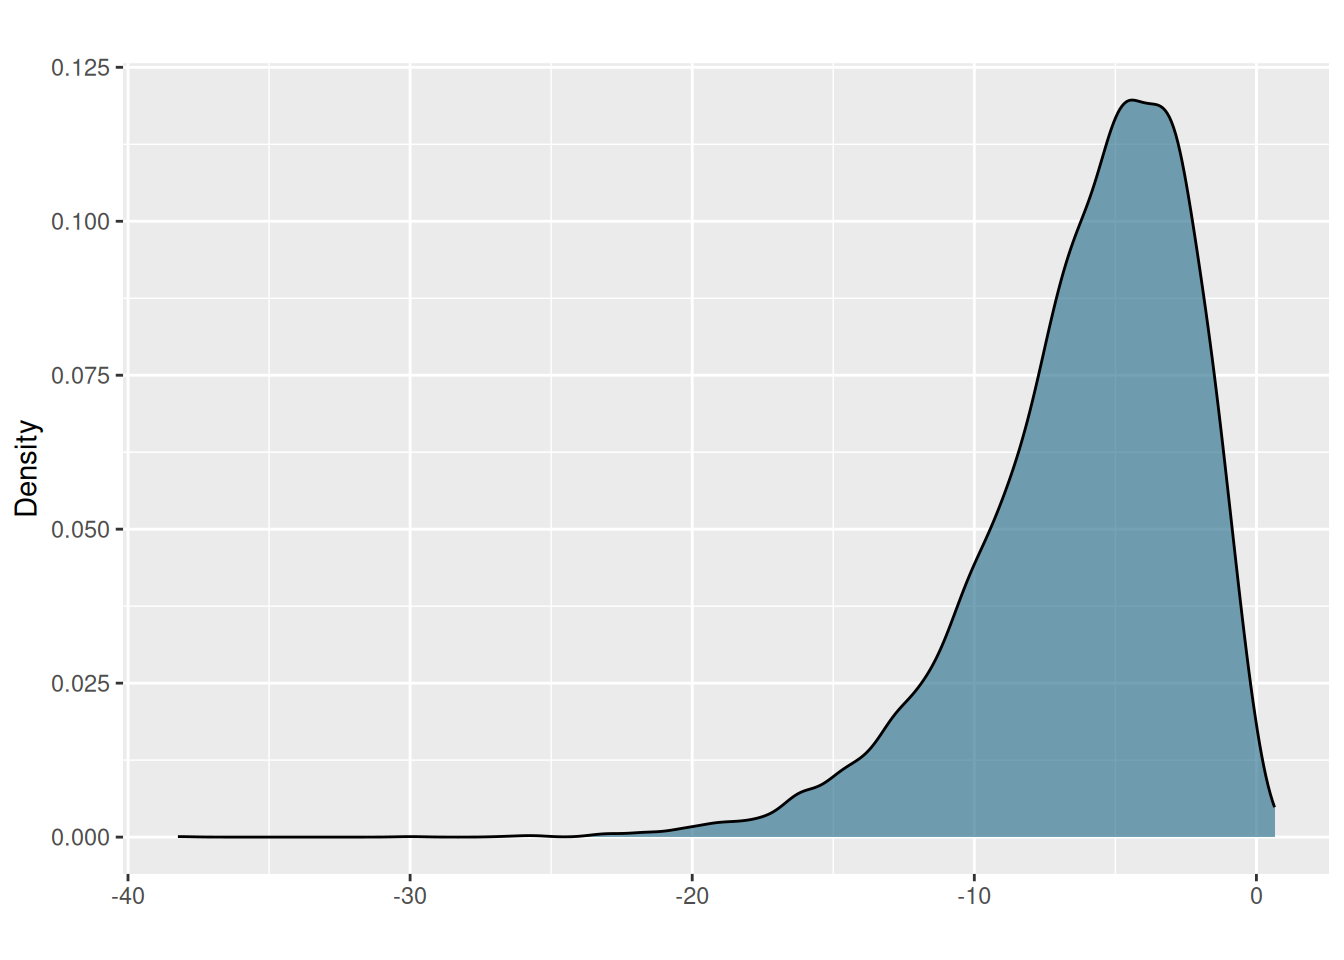
Suppose you take 1,000 samples of 15 values each. The means of these samples will follow the shape of what distribution?
What are the assumptions of using z-scores?
Explain whether or not each of the following is an example of independent events:
- Relative humidity at stations 500m apart from one another
- Income at the census tract level
- Heights of 100 randomly sampled individuals across the globe
- Explain why z-scores are inappropriate to use on the following dataset:
options <- c("Strongly disagree", "Disagree", "Neutral", "Agree", "Strongly agree")

set.seed(03262023)
results <- sample(options, size = 20, replace = TRUE)

print(results)
## [1] "Disagree" "Strongly disagree" "Agree"
## [4] "Strongly disagree" "Strongly agree" "Agree"
## [7] "Disagree" "Neutral" "Strongly disagree"
## [10] "Strongly agree" "Strongly agree" "Strongly disagree"
## [13] "Neutral" "Disagree" "Strongly agree"
## [16] "Strongly agree" "Neutral" "Neutral"
## [19] "Neutral" "Strongly agree"Extra computational questions (optional)
- Compute population standard deviation by hand on the following data set:
x = 18, 12, 13, 14, 13, 11What is the area under a standard normal distribution (i.e. the percentage of data or probability) that lies to the right of z = -0.7?
What is the area under a standard normal distribution (i.e. the percentage of data or probability) that lies to the left of z = -1.3?
p = 0.87 of the data in a normal distribution lies to the left of what z-score (1 pt.)?
Take a look at the
treeringdataset in R. What is the probability of observing a value between 1.2 and 1.8 (assume that this is a population)?